

Social media in politics has been big for some time. This year, the still-yet-to-be-called 2019 Australian Election will be impacted by social media more than ever before. Parties are going in to social media at a rate not seen in previous elections, and the numbers show.
Let’s look at the eleven Australian national political parties who have representatives in the Australian Parliament at the moment, and review some of their social media performance, and audience totals.
For the purpose of keeping this fairly succinct, I have used the 11 parties who have people in parliament currently. This doesn’t mean they will all stand for re-election and it doesn’t mean I am purposely ignoring other smaller parties. I have also ordered the parties by total representation across both houses, and then for the parties who have one representative, also alphabetically.
The political parties I looked at for this study, are (with total representatives in brackets);
- Australian Labor Party (95)
- Liberal Party of Australia (67)
- National Party of Australia (13)
- Australian Greens (10)
- Centre Alliance (3)
- Pauline Hanson’s One Nation (2)
- Australian Conservatives (1)
- Derryn Hinch’s Justice Party (1)
- Katter’s Australian Party (1)
- Liberal Democratic Party (1)
- United Australia Party (1)
The following graphs all show the party with the most elected people on the left (Labor with 95 people) through to the least represented on the right (United Australia with 1 person).
All data was collected within a few hours, for the week ending 6th April 2019. Only the national party social media accounts were used.
Note: You can click on any graph, to see a much larger version.
Total social media audience
The parties social media audiences definitely do not represent how well they are represented in our current parliament. Significantly lower social media audiences are shown for both the Nationals and Centre alliance.
This graph shows the combined social media audiences of both Facebook and Twitter for each party, all of which have a presence on these two major platforms.
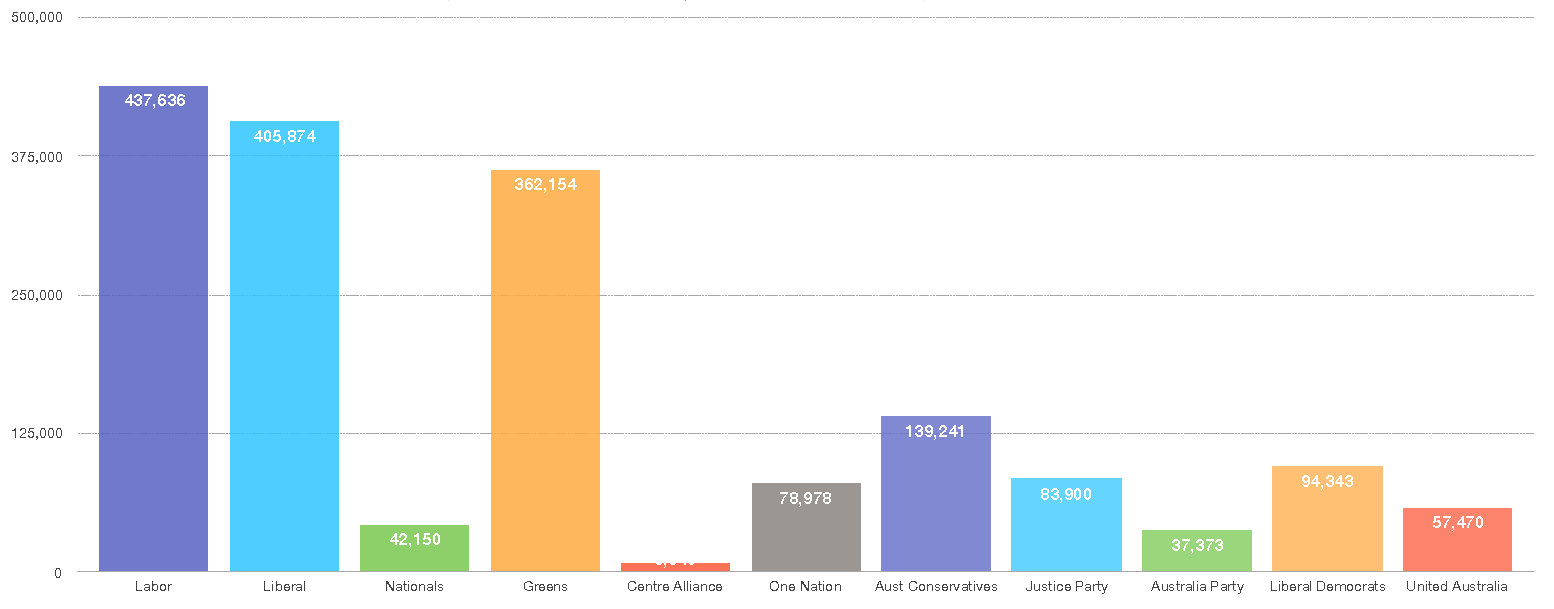
As the rest of the graphs below show, the three main parties on social media, across nearly all the metrics, are Australian Labor Party (Labor), Liberal Party of Australia (Liberals) and Australian Greens (Greens).
Following the total social media audiences above, the parties Twitter follower statistics are similar.
The party with the most followers is Labor, with 135,836 followers and the least followed is Katters Australia Party, with a measly 1,472 followers.
Twitter is notorious for automated bots and pretend profiles, so when you remove the ‘fake followers’ each party has, here is what you see;
According to the great tool Twitter Audit, each Australian political party has a number of fake followers, the most being Labor with 14,399 fake followers (11% of their total followers) through to the least fake followers Katters Australia Party with only 26 fake followers, or 2% of their audience.

To view each of these political parties Twitter Audit details, click on the party names to go straight to the public reports of the data;
- Australian Labor Party
- Liberal Party of Australia
- National Party of Australia
- Australian Greens
- Centre Alliance
- Pauline Hanson’s One Nation
- Australian Conservatives
- Derryn Hinch’s Justice Party
- Katter’s Australian Party
- Liberal Democratic Party
- United Australia Party
To be fair, I am not suggesting any party has even bought fake followers. To prove that, here’s my own audit, showing 2.8% of my Twitter followers also show as fake (I’ve never bought followers).
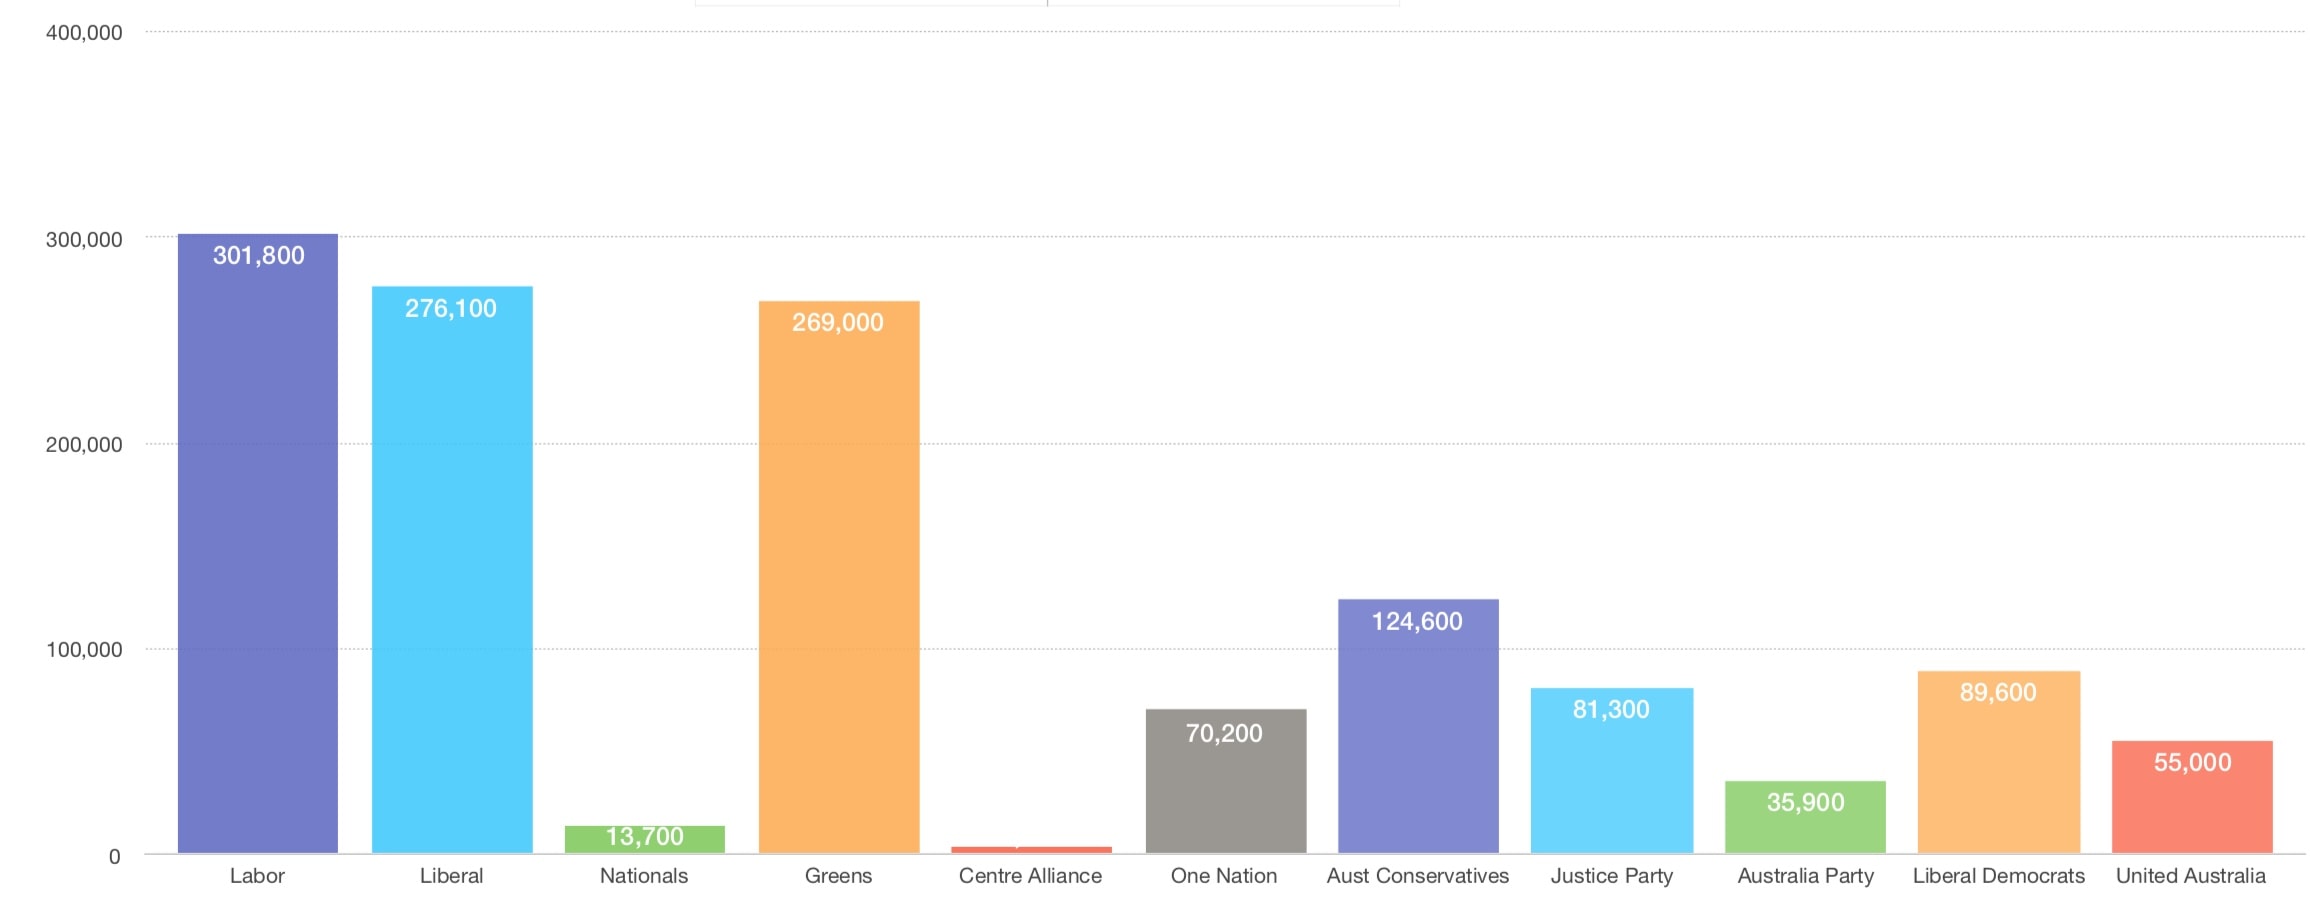
Each parties overall page likes on Facebook is fairly similar to their Twitter following. Labor once again topping the list with 301,800 page likes and the Centre Alliance coming in lowest with only 4,300 page likes.
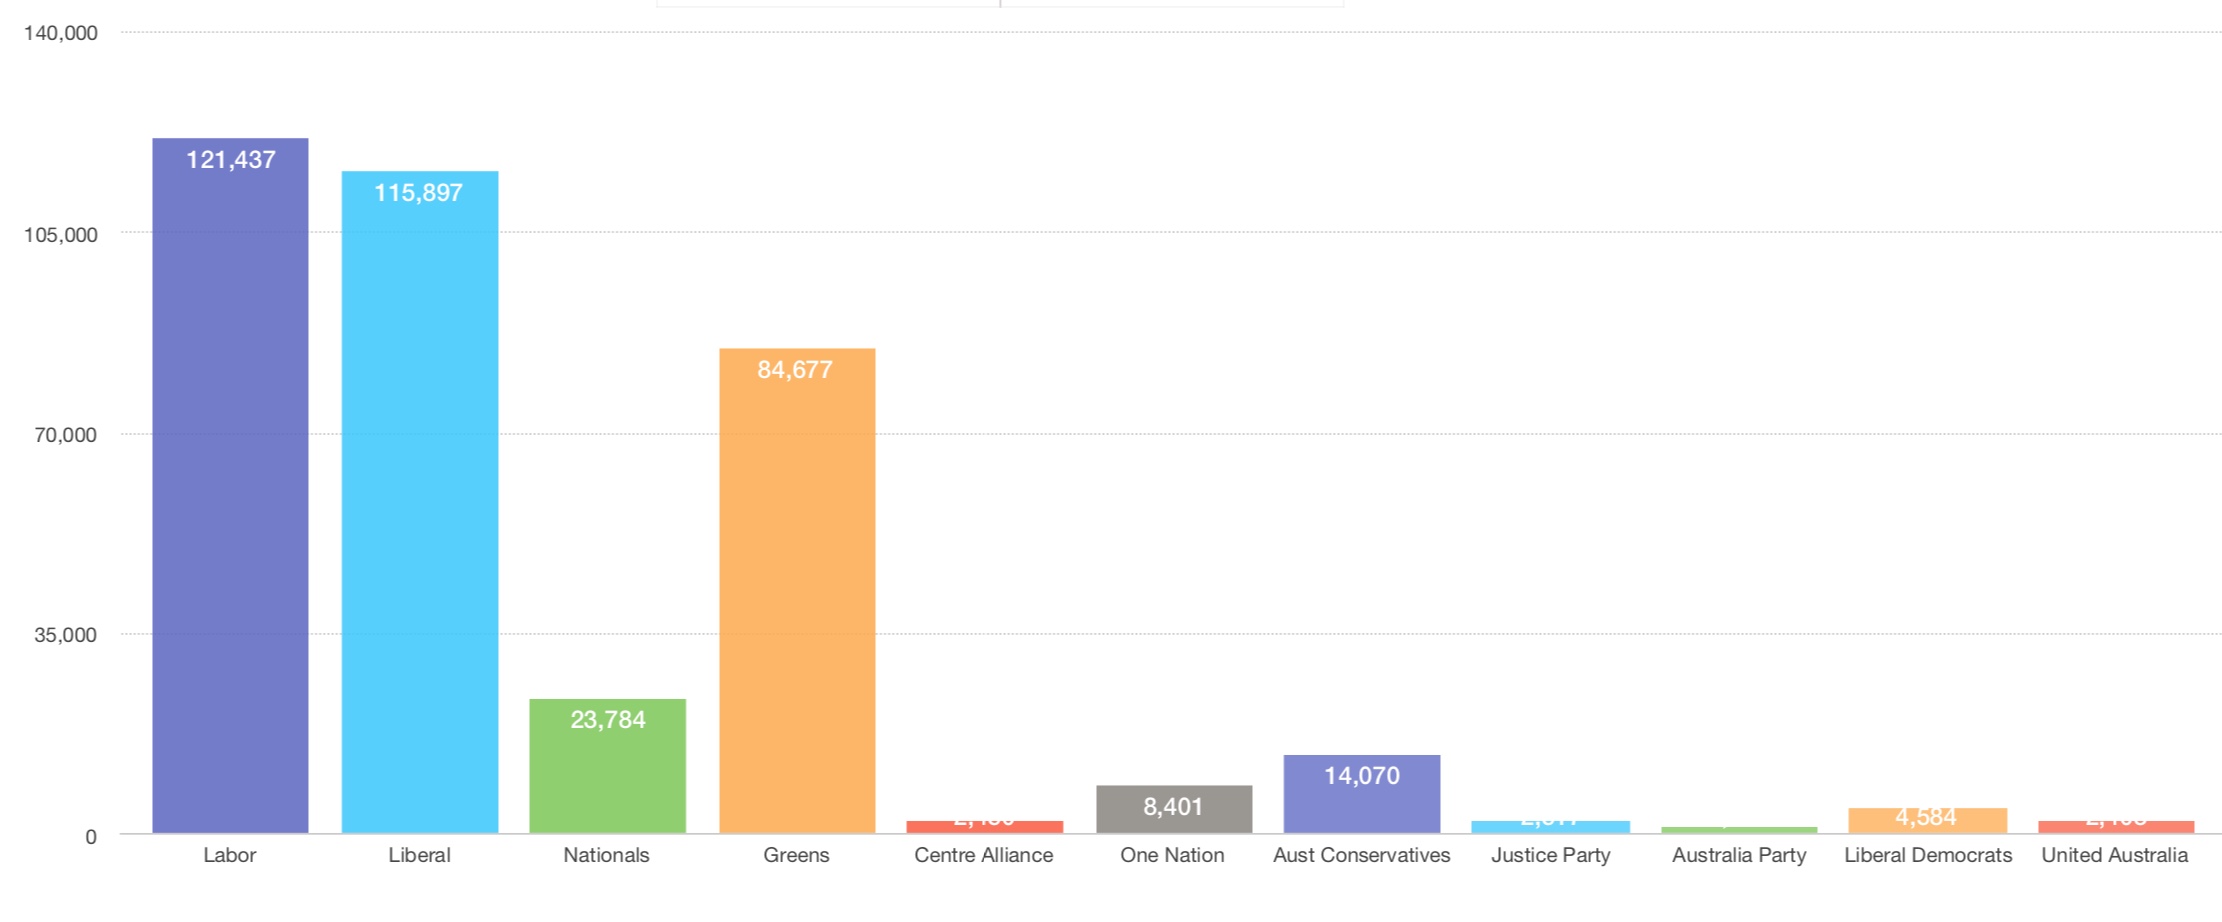
Facebook engagement
Facebook page likes are one thing, however a better metric is total engagement. Here’s the engagement every Australian political party had, in the seven days up until I ran these audits.
This is where the Liberal Party comes in at the top spot, with 177,500 Facebook accounts engaging with them, and the least, on a tiny 890, are Centre Alliance.
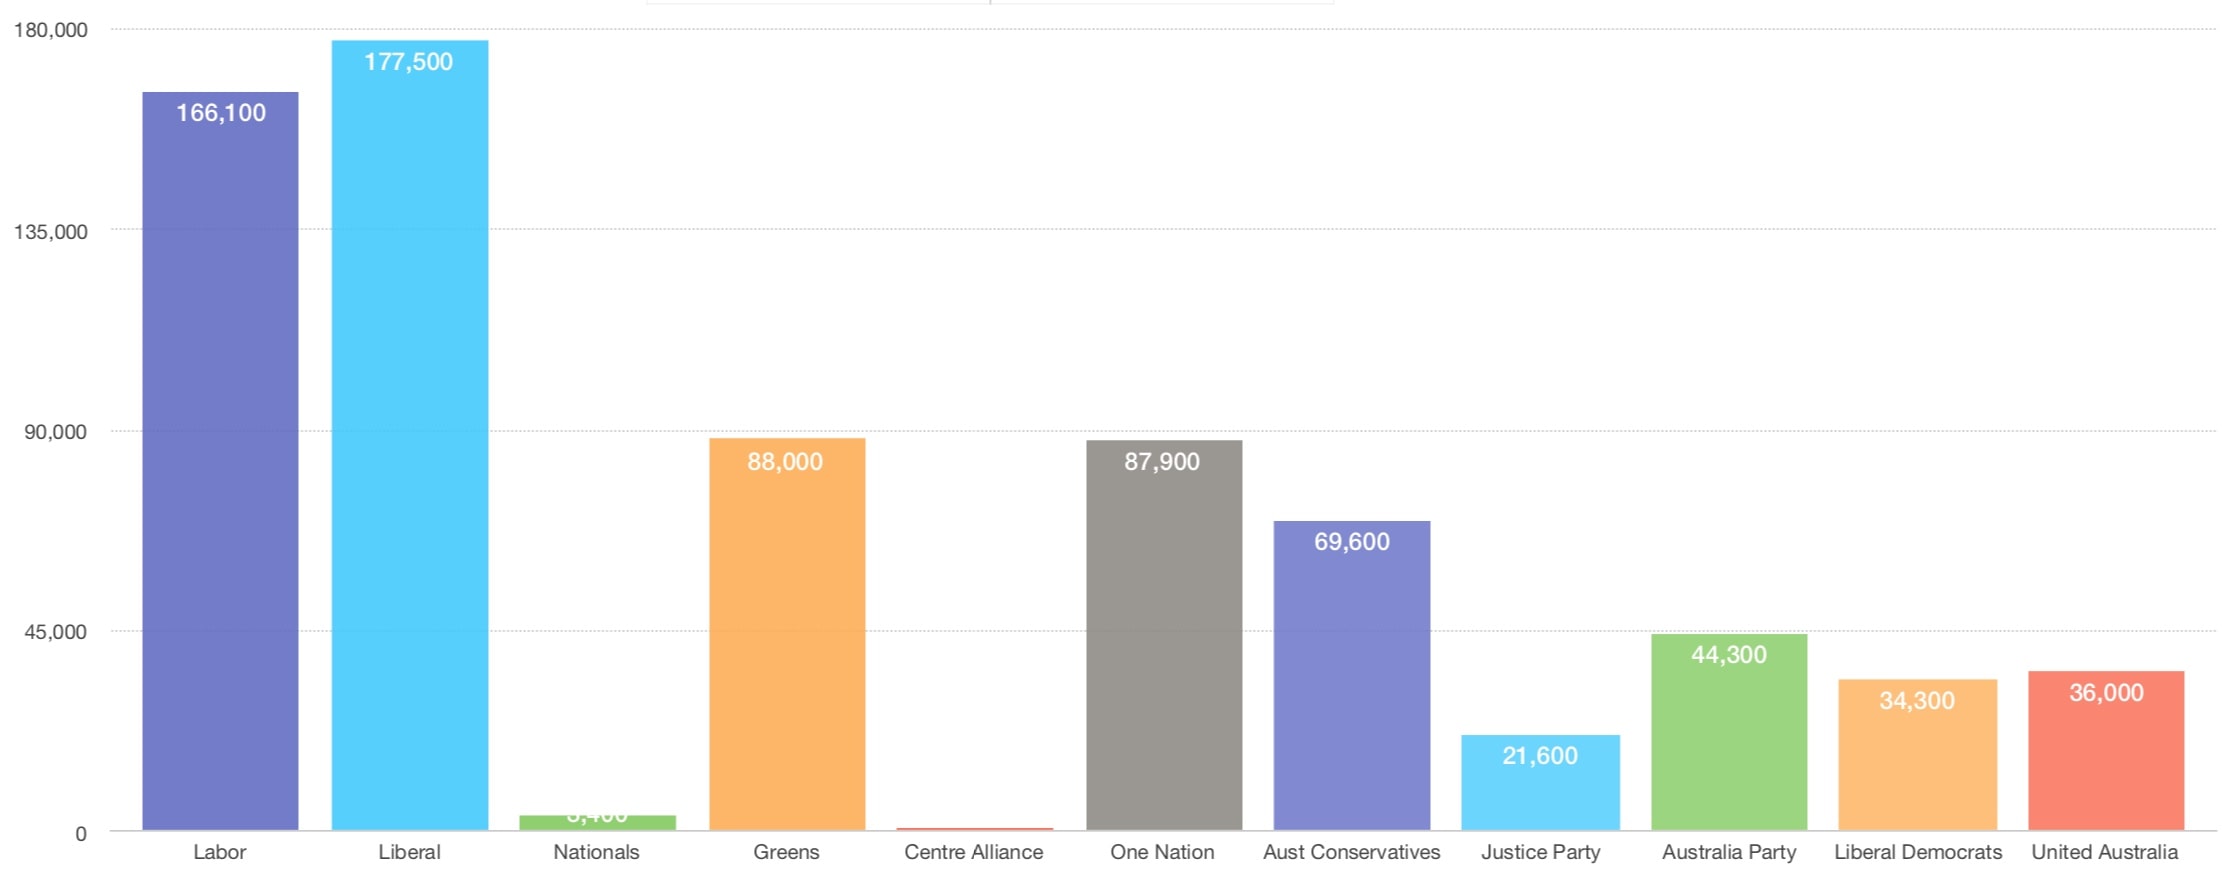
These engagement totals above are reflective of the amount of posts each party posted on their page that week. Labor posted a whopping 41 posts (5.85 posts a day), whereas many of the smaller parties didn’t even post every day.
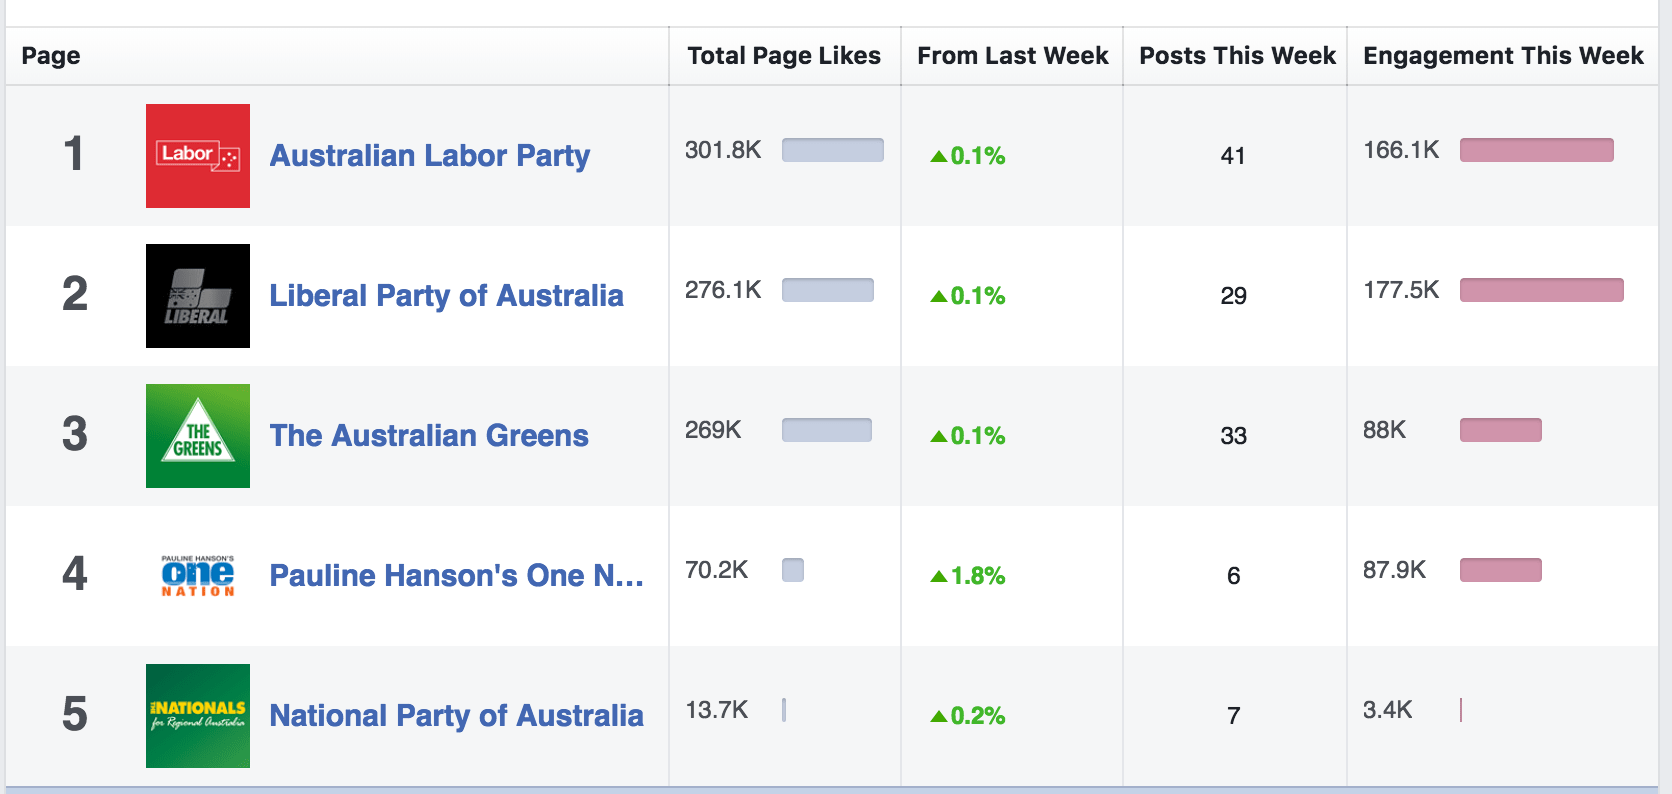
The above statistics were taken by using a Facebook business page, and adding all the parties as ‘competing pages’. The interface in Facebook looks like the following graphic.
Facebook Advertising
A few days ago, Facebook announced that they have banned foreign parties from advertising during the upcoming Australian election. Want to know what Facebook advertising are these parties running? Click on each of their names to go straight to a live and current list;
- Australian Labor Party
- Liberal Party of Australia
- National Party of Australia
- Australian Greens
- Centre Alliance
- Pauline Hanson’s One Nation
- Australian Conservatives
- Derryn Hinch’s Justice Party
- Katter’s Australian Party
- Liberal Democratic Party
- United Australia Party
Interestingly, at time of writing, only two parties had active Facebook advertising running.
The Liberal Party with an astonishing 99 campaigns, and the United Australia party with 6 campaigns.
See the short video, below.
In Summary
Whilst all the news are full of which party is spending what on traditional media advertising, it’s interesting to see that social media is increasing in importance at each Australian election.
Once the election has been announced, and in full swing, it would be an interesting exercise to collate all this data again – I imagine most parties will see similar lifts in their overall audiences and engagement.
You can see the data I collected as a Google Sheet over here. You’re welcome to take a copy and run your own analysis on the results. I look forward to seeing it!